- About Us
- Products
- Responsibility
- Research
- Media
- Investors
- Careers
About Us
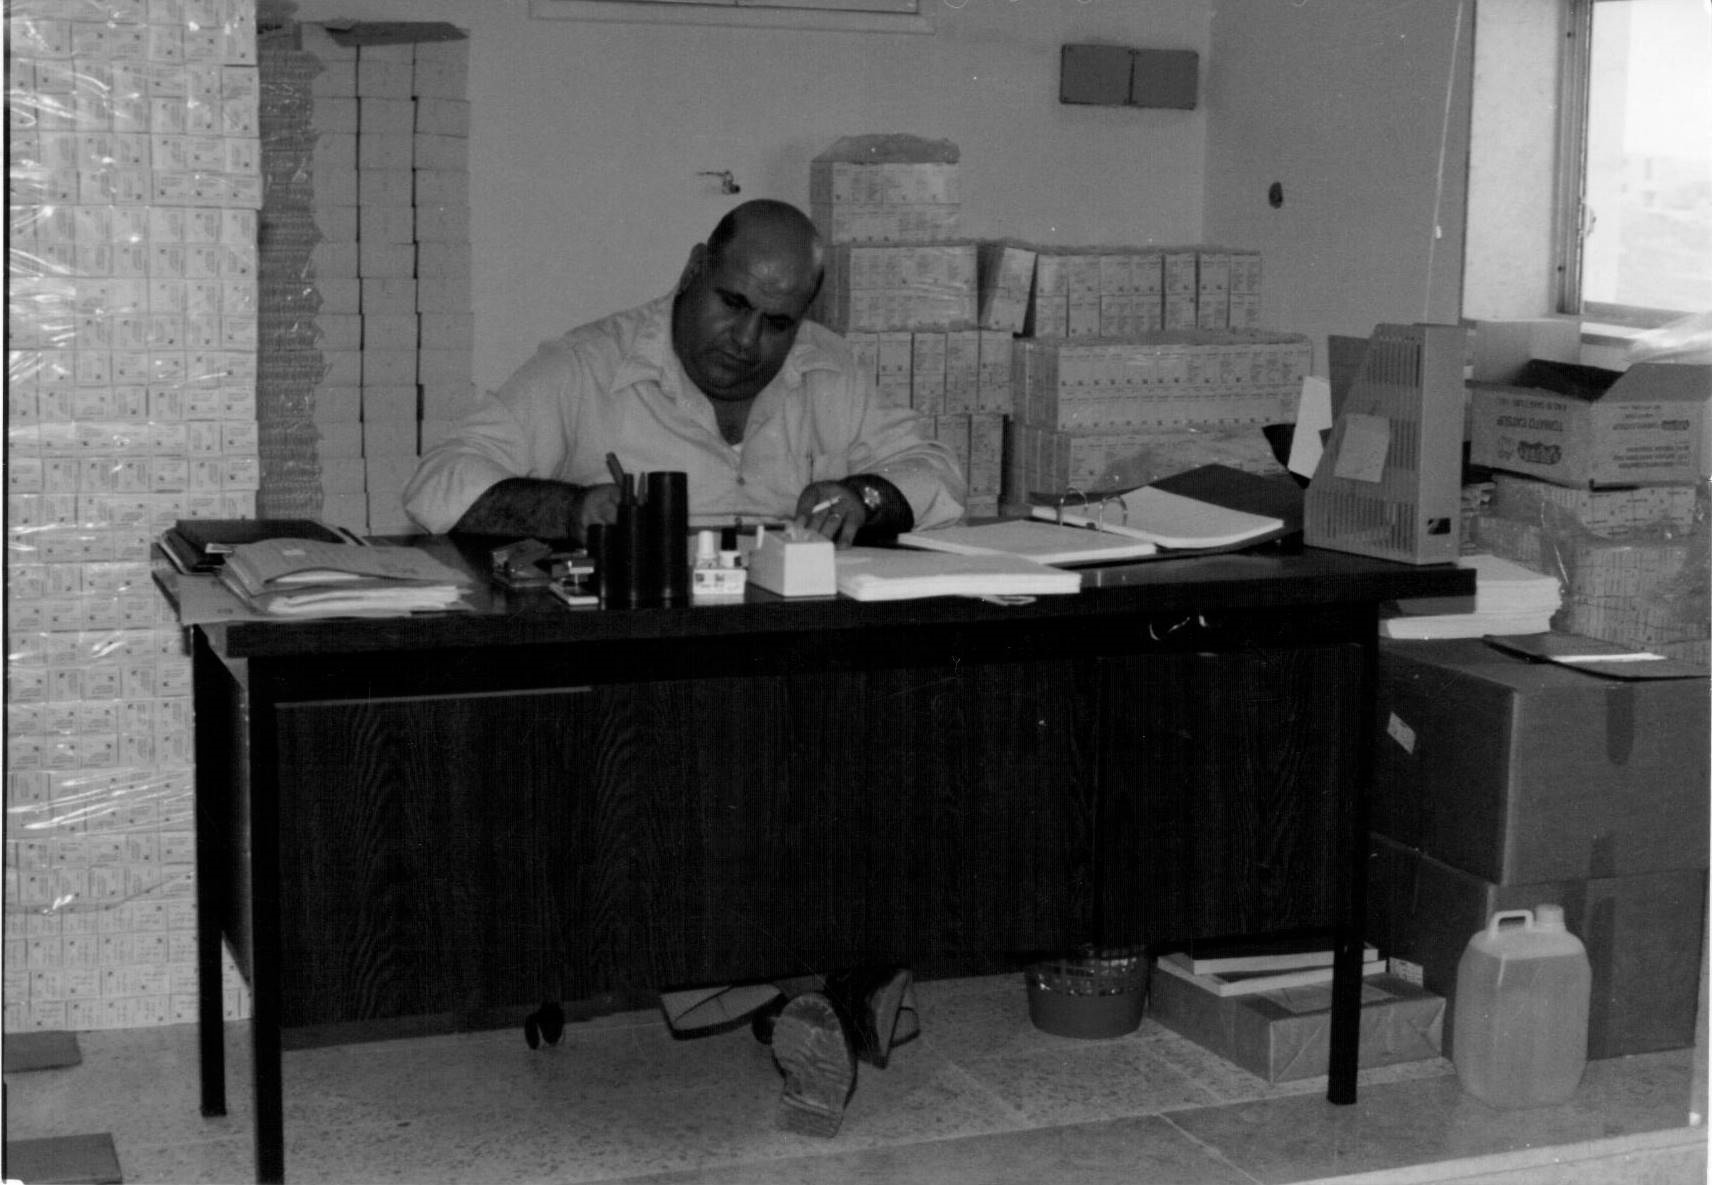
Pharmacare was established to manufacture and distribute pharmaceuticals by a group of Palestinian entrepreneurs led by Mr. Subhi Khoury, a pioneer pharmacist who started the first pharmaceutical manufacturing company in Jordan, in 1962. The company is located in a small environmental friendly industrial zone within the Beitunia district near Ramallah.

Products
Our services are divided within multiple categories between our manufactured pharmaceuticals, under-license products, our exclusive commercial proxy for high-profile European brands and other categories.


Responsibility
Highlights

Research
Finding innovative solutions for unmet medical needs is at the heart of what we do. Our ideas and research help save lives.
Highlights

Media
Our Window to the World: Pharmacare scoring several landmarks catching vigorous media attention

Investors
At Pharmacare, we try to promote successful returns to our shareholders, end-consumers and the wider community by means of a versatile business model